Sameer Mathur, Ph.D. (Carnegie Mellon University, Tepper School of Business) and Aryeman G. Mathur
- Our in-depth, quantitative analysis of Waste Management, Inc. (WM) in the Industrials sector yields a GPA-like score of 2.28 out of 4.0, leading us to a “SELL” recommendation.
- Our assessment specifically focuses on four key financial dimensions of WM: (i) price attractiveness, (ii) profitability, (iii) earnings and growth and (iv) dividend policies.
- We compare WM’s financial performance with that of 78 peers within the GICS Industrials sector to support our “SELL” recommendation.
Introduction
This report delves deep into Waste Management, Inc. (WM)’s financial and market positioning as of 10 April 2024. Positioned within the Industrials GICS sector, our analysis employs advanced data analytics to evaluate WM’s standing.
Investment Recommendation
Our detailed investigation reinforces our “SELL” recommendation, with WM scoring a GPA-like 2.28 out of 4.00. This conclusion is rooted in a comprehensive review across four critical financial dimensions —
- Share Price and Market Valuation: Analyzing WM’s market valuation against historical performance and moving averages to determine if the stock is under or overvalued in the current market context.
- Profitability: Reviewing WM’s efficiency in generating profits from its operations and assets using metrics such as return on equity, assets, and capital, alongside profit margins.
- Earnings and Growth: Investigating WM’s financial health and growth outlook through analysis of EPS growth, PE ratios, and other crucial indicators.
- Shareholder Returns: Evaluating WM’s dividend policies, including yield, growth, and payout ratios, to understand the company’s financial stability and its ability to consistently reward investors.
Grading Overview
Adopting a grading system akin to academic evaluation, Waste Management, Inc. (WM) has been rigorously assessed across the aforementioned metrics. This comprehensive analysis results in a Grade Point Average (GPA) of 2.28, reflecting WM’s position on a scale where 1.0 indicates a strong sell and 4.0 a strong buy recommendation.
Detailed Assessment
As delineated in Table 1, this grading provides a quantitative measure of Waste Management, Inc. (WM)’s standing relative to its Industrials sector peers within the S&P 500, substantiating the GPA of 2.28 and underpinning our investment recommendation.
TABLE 1: Performance Assessment and Letter Grades for Waste Management, Inc. (WM), as of 10 April 2024
| Analysis | Metric | Value | Grade |
| Price Attractiveness | Price rel. to 52-Week Low | 39.07 | B |
| Price Attractiveness | Price rel. to 200-Day EMA | 14.15 | C |
| Price Attractiveness | Price rel. to 50-Day EMA | 2.4 | C |
| Profitability | Return on Equity (ROE) | 33.51 | B |
| Profitability | Return on Assets (ROA) | 7.08 | C |
| Profitability | Return on Invested Capital (ROIC) | 10.21 | C |
| Profitability | Net Profit Margin (NPM) | 11.28 | C |
| Profitability | Operating Margin (OPM) | 18.72 | B |
| Earnings | PE Ratio (PE) | 36.75 | B |
| Earnings | PB Ratio (PB) | 12.11 | A |
| Earnings | EPS Growth (TTM YoY) | 5 | C |
| Earnings | EPS Growth (QYoY) | 0.6 | C |
| Earnings | Price/Earnings to Growth (PEG) | 7.28 | D |
| Dividends | Dividend Yield | 1.38 | B |
| Dividends | Dividend Growth | 7.7 | C |
| Dividends | Dividend Payout | 49.43 | D |
The GPA of 2.28 serves not just as an evaluation of WM’s current performance but as a pivotal benchmark within the competitive landscape of the S&P 500’s Industrials sector. This evaluation methodically aligns WM’s performance with the broader market, laying the groundwork for a comprehensive comparison against its peers. It’s through this detailed lens that we discern WM’s market position, informing our investment recommendation of “SELL”.
Comparative Analysis Scope
To anchor our analysis in a broader market context, we analyze Waste Management, Inc. (WM) relative to all 78 constituents within the Industrials GICS sector of the S&P 500. Table 2 lists these stocks, serving as a foundation for our comparative evaluation.
TABLE 2: Companies in the GICS Industrials Sector in the S&P 500.
| Tickers |
| WM, CAT, GE, UBER, UNP, RTX, HON, ETN, UPS, DE, LMT, BA, ADP, GD, ITW, PH, CSX, CTAS, NOC, TDG, TT, FDX, EMR, PCAR, RSG, NSC, CPRT, MMM, CARR, GWW, ODFL, URI, PAYX, JCI, CMI, FAST, AME, OTIS, LHX, IR, PWR, VRSK, ROK, XYL, EFX, DAL, FTV, HWM, WAB, AXON, BR, DOV, BLDR, ROL, HUBB, VLTO, JBHT, TXT, J, IEX, LDOS, EXPD, LUV, MAS, NDSN, SNA, SWK, UAL, PNR, AOS, PAYC, ALLE, HII, AAL, CHRW, GNRC, RHI, CDAY |
We invite you to delve into the subsequent sections for a comprehensive understanding of the factors influencing WM’s competitive positioning and our ‘SELL’ recommendation.
Section 1 – Analyzing the Price Attractiveness of WM in the Industrials Sector
1.1 Evaluating WM’s Current Market Price
We compare the current market price of WM, at $208.2, against critical valuation benchmarks: its 52-week low ($149.71), 200-day Exponential Moving Average (EMA, $182.39), and 50-day EMA ($203.32). By comparing WM’s price with these benchmarks, we contextualize its current valuation against both historical performance and recent market trends.
- Low_52% = ((Price – 52 Week Low) / 52 Week Low) * 100
- EMA_200% = ((Price – EMA_200) / EMA_200) * 100
- EMA_50% = ((Price – EMA_50) / EMA_50) * 100
These metrics allow us to assess WM’s market price from a multi-angle perspective, highlighting its valuation nuances. The outcome, presented in the following table, offers a quantitative view of WM’s position against the selected benchmarks for evaluating its price attractiveness.
TABLE 3: Market Price Benchmark Analysis for WM, as of 10 April 2024
| Metric | Price | PriceDifference |
| EMA_200 | 182.39 $ | 14.15 % |
| EMA_50 | 203.32 $ | 2.4 % |
| 52 Week Low | 149.71 $ | 39.07 % |
1.2 Benchmarking the Price Attractiveness of WM within the Industrials Sector
Extending our analysis, we delve into the distribution of stock prices within the Industrials sector, with a specific focus on their relationships with their respective 52-week lows, 200-day EMAs, and 50-day EMAs.
The following table provides a comprehensive summary of the sector’s price distribution, including key statistical measures such as the first quartile (Q1), the median, and the third quartile (75th percentile).
TABLE 4: Price Distribution within the Industrials Sector, as of 10 April 2024
| Metrics | 1st Qu. | Median | 3rd Qu. |
| Low52P | 25.8 | 39.1 | 56.1 |
| EMA200P | 3.4 | 9.7 | 17.9 |
| EMA50P | -0.8 | 1.8 | 4.9 |
By comparing WM’s price performance to the overall performance of the Industrials sector, we can understand its market standing and how appealing it is within this sector.
For instance, comparing the data reveals that while WM’s current price stands 39.07% above its 52-week low, the median for all stocks in the Industrials sector is 39.1% above their respective 52-week lows.
1.3 Comparative Analysis of WM’s Position in its Sector
Moving from numbers to visuals, we delve into the price behavior of WM against the backdrop of the Industrials sector. Our goal is to graphically showcase WM’s market positioning, focusing on its recovery from the annual low and its relationship with established moving averages.
In Figure 1, we examine WM’s resilience and market appeal by mapping its bounce back from its 52-week low alongside its variance from the 200-day EMA. Placed within the broader Industrials landscape, this visual illustrates WM’s price movement compared to sector norms, with orange lines marking sector medians.
FIGURE 1: Medium-Term Price Trends – Comparison with 200-Day EMA, in the Industrials sector, as of 10 April 2024.
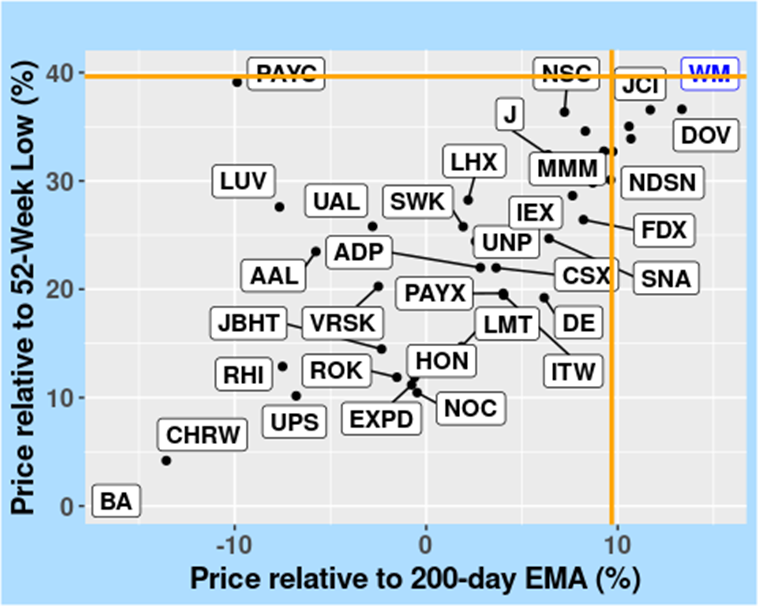
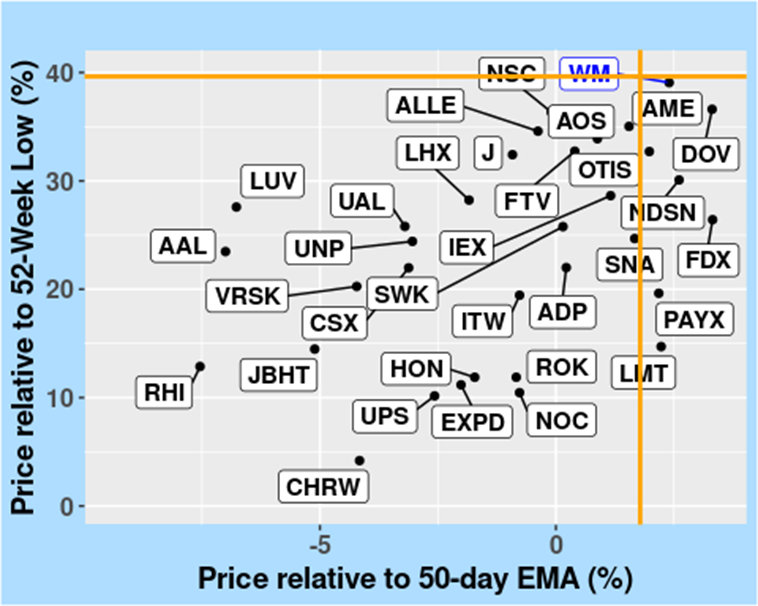
Figure 2 shows how WM has moved up from its lowest price in the past year and compares its recent price to the 50-day moving average. This gives us a quick look at WM’s recent price changes against the short-term trends in the Industrials sector.
FIGURE 2: Short-Term Price Trends – Comparison with 50-Day EMA, in the Industrials sector, as of 10 April 2024.
The graphs clearly depict WM’s price behavior in the Industrials sector, highlighting how it compares with wider sector trends. They effectively show WM’s short- and medium-term price strength and movement, visually summarizing its appeal compared to other companies in the sector.
1.4 Evaluating Price Attractiveness
To gauge WM’s Price Attractiveness, we compare it against benchmarks within the Industrials sector—specifically, the 25th, 50th (median), and 75th percentiles. This approach places WM in context with its peers, spotlighting its position in terms of price appeal.
We favor lower values for Price Attractiveness metrics (like proximity to the 52-week low or deviation from moving averages). Table 5 categorizes these metrics into letter grades from A to D for easy understanding.
TABLE 5: Grading Scale for “Less is Better” Metrics
| Metric Range | Grade |
| Metric < Q1 | A |
| Q1 < Metric < Median | B |
| Median < Metric < Q3 | C |
| Metric > Q3 | D |
Table 6 showcases the application of our grading criteria to WM’s metrics, summarizing its price attractiveness.
TABLE 6: Letter Grades for WM’s Price Attractiveness Metrics
| Metric | Value | Grade |
| Price rel. to 52-Week Low | 39.07 | B |
| Price rel. to 200-Day EMA | 14.15 | C |
| Price rel. to 50-Day EMA | 2.4 | C |
These grades succinctly summarize how WM’s price performance compares to the broader Industrials sector, offering insights into its relative investment appeal based on historical price positions and trends.
1.5 Summary of Waste Management, Inc. (WM)’s Price Attractiveness
Our analysis of Waste Management, Inc. (WM)’s price attractiveness offers a comprehensive understanding of its market position within the Industrials sector. By examining its performance relative to key financial benchmarks and sector-wide trends, we gain valuable insights into its current market appeal and competitive stance.
Section 2 – Analyzing the Profitability of WM in the Industrials Sector
2.1 Evaluating WM’s Profitability Metrics
Our assessment of WM’s financial health involves scrutinizing its profitability across five key metrics. These metrics offer insights into its operational efficiency and financial performance:
- Return on Equity (ROE): Measures the ability of WM to generate profits from shareholder equity.
- Return on Assets (ROA): Measures the efficiency of WM in utilizing its assets to generate profits.
- Return on Invested Capital (ROIC): Measures WM’s profitability from both debt and equity capital.
- Operating Margin (OPM): Measures the core profitability of WM’s operations.
- Net Profit Margin (NPM): Measures the percentage of revenue that translates into net profit after accounting for all expenses.
These metrics collectively provide a comprehensive understanding of WM’s financial performance and its capacity to sustainably generate returns. The profitability metrics for WM are summarized in Table 7:
TABLE 7: Profitability of WM, as of 10 April 2024.
| Metric | Value |
| Return on Equity (ROE) | 33.51 |
| Return on Assets (ROA) | 7.08 |
| Return on Invested Capital (ROIC) | 10.21 |
| Net Profit Margin (NPM) | 11.28 |
| Operating Margin (OPM) | 18.72 |
2.2 Benchmarking the Profitability of WM against the Industrials Sector
We delve deeper into comparing WM’s profitability with its peers in the Industrials Sector. Table 8 showcases a summary of the sector’s profitability, highlighting the first quartile (Q1), the median, and the third quartile (75th percentile).
TABLE 8: Industrials Sector, Profitability, as of 10 April 2024.
| Metrics | 1st Qu. | Median | 3rd Qu. |
| ROE | 13 | 22.6 | 35.1 |
| ROA | 5 | 8.6 | 12.6 |
| ROIC | 7.2 | 12.6 | 20.4 |
| NPM | 6.3 | 11.4 | 15.4 |
| OPM | 9.6 | 17 | 20.8 |
By comparing WM’s key profitability metrics to the sector average, we understand its standing. For example, WM’s ROE, ROA, and ROIC stand at 33.51%, 7.08%, and 10.21%. These can be measured against the sector’s median and third quartile to judge its profitability. Similarly, its OPM and NPM, at 18.72% and 11.28%, provide insight into its operational efficiency and profitability compared to sector norms.
2.3 Comparative Visualization of WM’s Profitability in its Sector
We use visual comparisons to better grasp WM’s profitability against the Industrials sector. This approach helps show how WM stands out among its competitors in terms of profitability.
The charts below compare WM’s performance in key profitability metrics—ROA, ROE, and ROIC—with those of its sector peers. Orange lines represent the sector medians, providing a benchmark for WM’s position.
FIGURE 3: Return on Assets (ROA) versus Return on Equity (ROE), in the Industrials Sector, as of 10 April 2024.
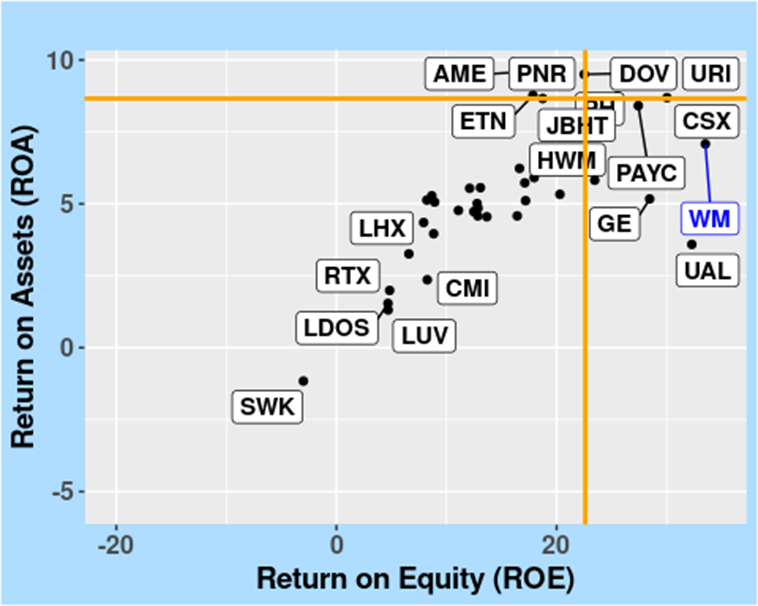
FIGURE 4: Return on Assets (ROA) versus Return on Invested Capital (ROIC), in the Industrials Sector, as of 10 April 2024.
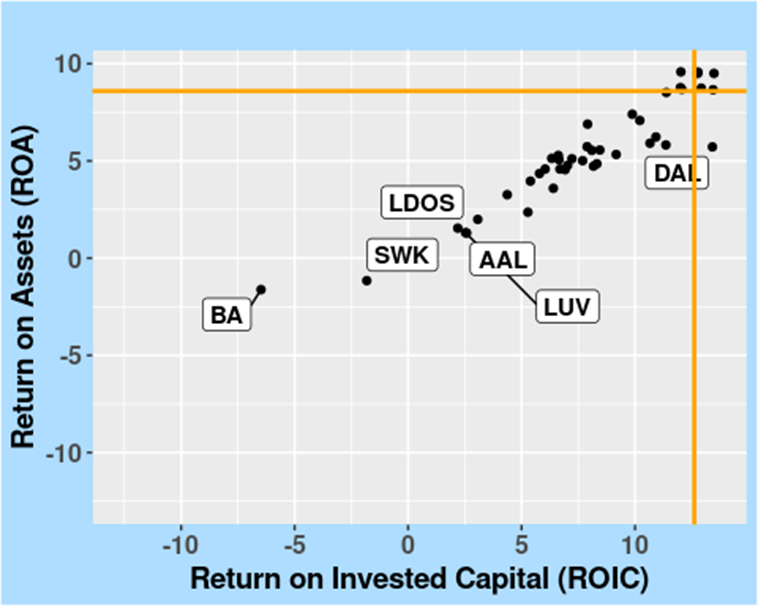
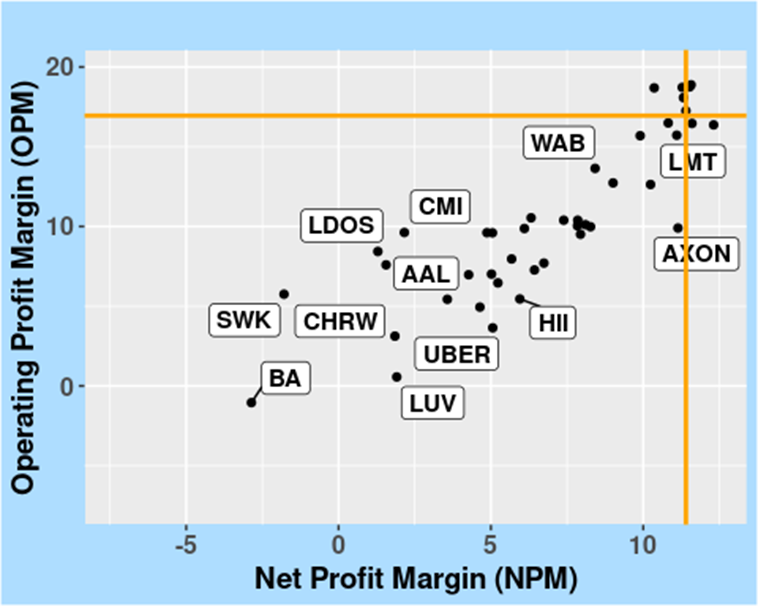
Figure 5 complements the previous figures by showing how WM’s Operating Margin (OPM) and Net Profit Margin (NPM) compare with others in the Industrials sector.
FIGURE 5: Comparing OPM and NPM of WM within the Industrials sector, as of as of 10 April 2024.
2.4 Grading Profitability Metrics
We grade WM’s profitability by comparing it with sector benchmarks: the 25th, median, and 75th percentiles. This system ranks WM against its peers based on profitability metrics like ROE, where higher values are better. The table below categorizes these metrics into letter grades from A to D for clear evaluation.
TABLE 9: Grading Scale for “More is Better” Metrics
| Metric Range | Grade |
| Metric < Q1 | D |
| Q1 < Metric < Median | C |
| Median < Metric < Q3 | B |
| Metric > Q3 | A |
The table below summarizes WM’s profitability metrics, graded against sector peers based on our criteria, providing a clear performance overview.
TABLE 10: Letter Grades for WM’s Profitability Metrics Compared to the Industrials Sector
| Metric | Value | Grade |
| Return on Equity (ROE) | 33.51 | B |
| Return on Assets (ROA) | 7.08 | C |
| Return on Invested Capital (ROIC) | 10.21 | C |
| Net Profit Margin (NPM) | 11.28 | C |
| Operating Margin (OPM) | 18.72 | B |
2.5 Summary of Waste Management, Inc. (WM) Profitability
Our thorough examination of Waste Management, Inc. (WM) delves into its profitability within the Industrials sector, assessing key performance indicators like Return on Equity (ROE), Return on Assets (ROA), Return on Invested Capital (ROIC), Operating Margin (OPM), and Net Profit Margin (NPM). These metrics are crucial for understanding the company’s ability to generate profits, efficiently utilize assets, and manage operational costs, all of which are fundamental to its financial health and operational efficiency.
By scrutinizing these metrics, we identify both strengths and areas for improvement, offering valuable insights into WM’s current financial standing. Furthermore, our analysis juxtaposes WM’s performance against sector benchmarks, providing investors with a clear view of its competitive position and potential growth strategies.
Incorporating these insights empowers investors to make well-informed decisions regarding Waste Management, Inc. (WM)’s investment potential, considering its profitability within the Industrials sector.
Section 3 – Evaluating Earnings Metrics for WM in the Industrials Sector
3.1 Earnings Performance Analysis
We analyze WM’s earnings through five critical metrics to assess its valuation and growth potential, guiding investor decisions.
- Price-to-Earnings Ratio (PE) reflects market valuation relative to earnings, where a higher PE indicates positive future performance expectations.
- Price-to-Book Ratio (PB) contrasts market value with book value, with lower ratios suggesting undervaluation.
- Earnings Per Share Growth (TTM YoY) shows earnings growth over the past year, indicating the company’s earning capacity.
- Earnings Per Share Growth (Quarterly YoY) provides a glimpse into the company’s short-term earnings momentum.
- Price/Earnings to Growth Ratio (PEG) combines valuation and growth, where lower ratios point to undervaluation relative to growth prospects.
Collectively, these indicators offer a nuanced view of WM’s financial health and growth potential, essential for making informed investment choices.
TABLE 11: Earnings Metrics for WM, as of 10 April 2024
| Metric | Value |
| PE Ratio (PE) | 36.75 |
| PB Ratio (PB) | 12.11 |
| EPS Growth (TTM YoY) | 5 |
| EPS Growth (QYoY) | 0.6 |
| Price/Earnings to Growth (PEG) | 7.28 |
3.2 Benchmarking WM’s Earnings against the Industrials Sector
We extend our analysis to compare the earnings metrics of WM with the broader Industrials sector, providing investors with valuable insights into its financial standing relative to its peers.
TABLE 12: Summary Statistics of Earnings Metrics in the Industrials Sector, as of 10 April 2024.
| Metrics | 1st Qu. | Median | 3rd Qu. |
| PE | 21.1 | 28.6 | 38.1 |
| PB | 3.8 | 5.7 | 9.6 |
| EPS_TTMYoY | -7.3 | 13.9 | 28.4 |
| EPS_QYoY | -7.1 | 9.4 | 36.1 |
| PEG | -0.6 | 0.7 | 1.7 |
By benchmarking WM’s earnings metrics against those of its sector peers, we gain valuable insights into its financial performance and market positioning. Specifically, we focus on the following metrics: PE Ratio (PE), PB Ratio (PB), EPS Growth (TTM YoY), EPS Growth (QYoY), and Price/Earnings to Growth (PEG).
This comparative analysis not only illuminates WM’s financial standing and growth potential but also provides context by situating its performance within the broader market landscape, assisting investors in making informed decisions.
3.3 Comparative Visualization of WM’s Earnings in its Sector
We visualize WM’s earnings within the Industrials sector, comparing it with peers using key metrics: PE Ratio, PB Ratio, EPS Growth (TTM YoY), EPS Growth (QYoY), and PEG Ratio. Orange lines indicate sector medians, benchmarking WM’s performance. These graphics give a clear comparison of WM’s valuation and growth, relative to the Industrials sector, helping investors assess its potential against sector trends. This visual approach aids in informed investment decisions.
FIGURE 6: Price to Earnings (PE) versus Price to Book (PB) ratios in the Industrials Sector, as of 10 April 2024.
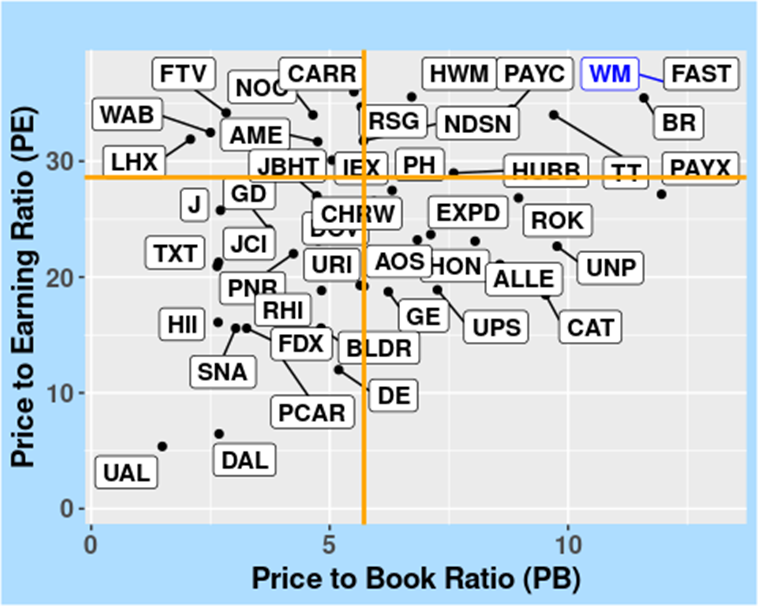
FIGURE 7: Earnings Per Share Growth, particularly EPS Growth (TTM YoY) versus EPS Growth (QYoY), in the Industrials Sector, as of 10 April 2024.
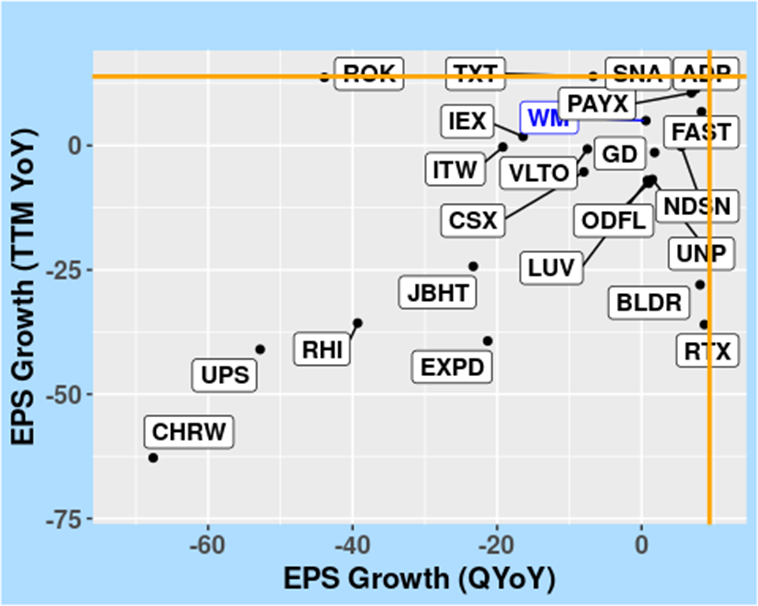
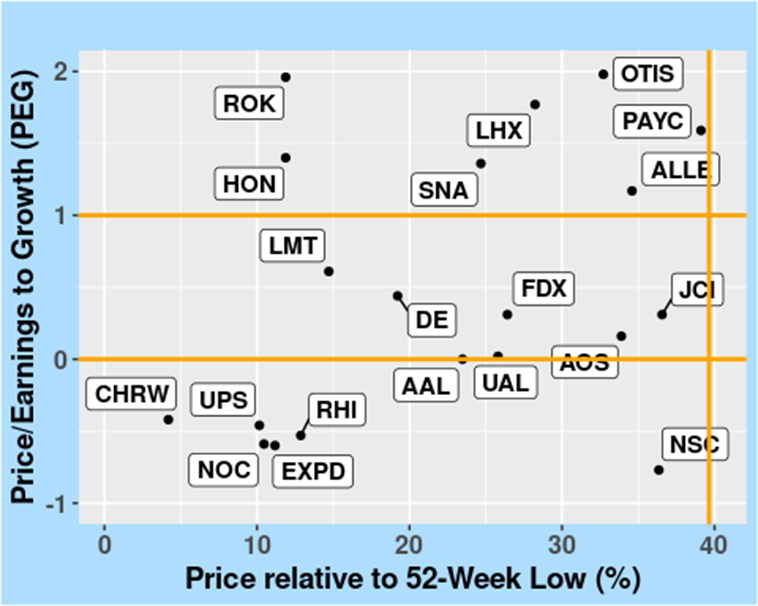
FIGURE 8: Price/Earnings to Growth (PEG) Ratios, in the Industrials Sector, as of 10 April 2024.
3.4 Assigning Letter Grades to Earnings Metrics
Our grading approach for WM’s earnings metrics blends traditional and nuanced criteria. Lower values in PE and PB Ratios signal superior valuations, thus receiving higher grades under our “less is better” paradigm. Conversely, higher figures in EPS Growth (TTM YoY) and EPS Growth (QYoY) reflect stronger financial health, meriting higher grades in our “more is better” framework. The PEG ratio, ideally between 0 and 1, gets special consideration for indicating a stock’s balanced growth and value, guiding our tailored grading. This method ensures a thorough comparison of WM against Industrials peers, respecting the distinct implications of each metric.
The distribution of Letter Grades for “more is better” metrics is summarized in TABLE 9. The distribution of Letter Grades for “less is better” metrics is as follows:
TABLE 13: Distribution of Letter Grades for “Less is Better” Metrics
| Metric | Grade |
| Value < Q1 | A |
| Q1 < Value < Median | B |
| Median < Value < Q3 | C |
| Value > Q3 | D |
TABLE 14: Grading WM’s Earnings Performance Relative to the Industrials Sector
| Metric | Value | Grade |
| PE Ratio (PE) | 36.75 | B |
| PB Ratio (PB) | 12.11 | A |
| EPS Growth (TTM YoY) | 5 | C |
| EPS Growth (QYoY) | 0.6 | C |
| Price/Earnings to Growth (PEG) | 7.28 | D |
3.5 Summary of Earnings Analysis for Waste Management, Inc. (WM)
Our comprehensive analysis of Waste Management, Inc. (WM)’s earnings metrics provides valuable insights into its valuation, growth potential, and market sentiment within the Industrials sector. By examining key indicators such as the Price-to-Earnings Ratio (PE), Price-to-Book Ratio (PB), Earnings Per Share Growth (TTM YoY and QoQ), and Price/Earnings-to-Growth (PEG) Ratio, we gain a nuanced understanding of WM’s financial performance.
Benchmarking WM against sector peers reveals its relative standing in terms of growth, value, and market expectations. Visual representations further elucidate these comparisons, aiding investors in grasping WM’s position within the broader market landscape.
Furthermore, our grading system provides a structured framework for assessing WM’s earnings performance. By considering the unique characteristics of each metric, investors can gauge Waste Management, Inc. (WM)’s strengths and weaknesses more accurately, facilitating informed investment decisions.
Section 4 – Dividends Analysis for WM within the Industrials Sector
We delve into WM’s dividend approach, contrasting it with sector peers to gauge its shareholder value proposition.
4.1 Dividend Metrics of WM
We evaluate WM on:
- Dividend Yield: Investors’ income per invested dollar, highlighting the stock’s income generation.
- Dividend Growth (Year-over-Year): Shows the company’s increasing commitment to shareholders, reflecting growth and financial health.
- Dividend Payout Ratio: The earnings portion distributed as dividends. Lower ratios may indicate growth potential; higher ratios suggest a stable, mature company prioritizing shareholder returns.
The table below details WM’s recent dividend performance, showcasing its commitment to dividend distribution.
TABLE 15: WM’s Dividend Performance, as of 10 April 2024.
| Metric | Value |
| Dividend Yield | 1.38 |
| Dividend Growth | 7.7 |
| Dividend Payout | 49.43 |
4.2 Comparative Analysis of Dividend Metrics in the Industrials Sector
To contextualize WM’s dividend performance within the industry, we benchmark it against the broader Industrials sector. The following table presents summary statistics for the sector’s dividend metrics, offering a comparative backdrop for evaluation.
TABLE 16: Distribution of Dividend Metrics in the Industrials Sector, as of 10 April 2024.
| Metrics | 1st Qu. | Median | 3rd Qu. |
| DivYield | 0.6 | 1.1 | 1.8 |
| DivGrowth | 5 | 7.8 | 13.4 |
| DivPayout | 12.1 | 29.4 | 49.2 |
4.3 Visualizing WM’s Dividend Performance
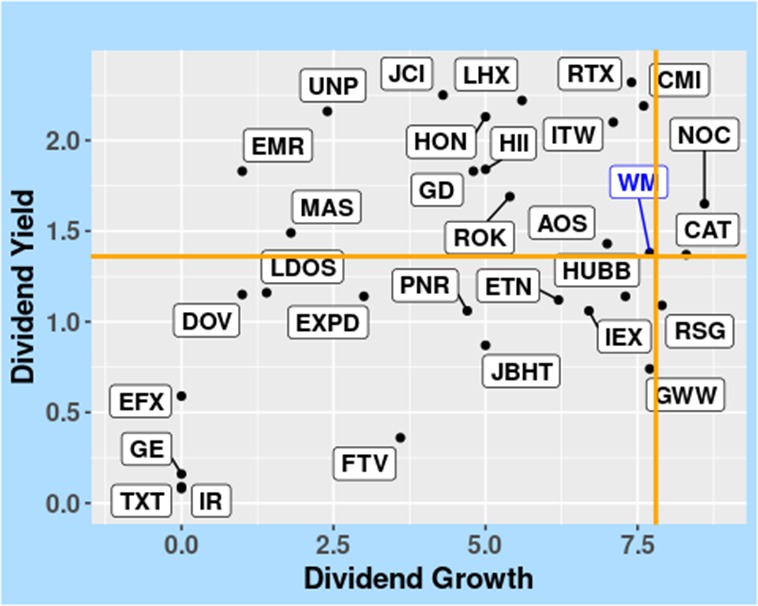
We graphically compare WM’s dividend yield and growth against sector peers. Scatterplots illustrate its standing on dividend attractiveness and policy evolution within its sector, providing a visual perspective on its competitive positioning.
FIGURE 9: Dividend Yield vs. Dividend Growth in the Industrials Sector, as of 10 April 2024.
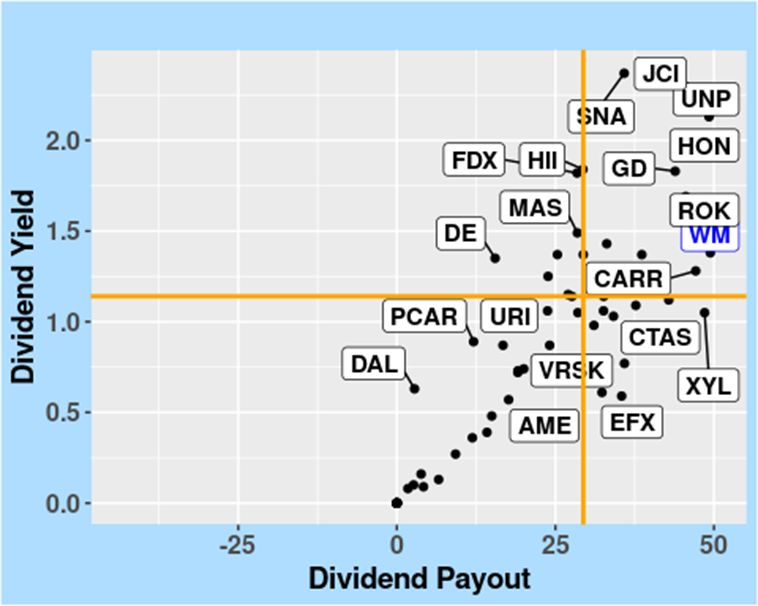
The subsequent Figure provides additional insights into WM’s dividend yield by examining its relationship with the dividend payout ratio. This analysis sheds light on the sustainability and growth prospects of the company’s dividend policy within the context of the Industrials sector.
FIGURE 10: Dividend Yield vs. Dividend Payout in the Industrials Sector, as of 10 April 2024.
4.4 Assigning Letter Grades to Dividends
In evaluating WM’s dividends, we favor higher Dividend Yield and Dividend Growth for their income generation and investor reward growth, rewarding such metrics with superior grades. In contrast, a modest Dividend Payout Ratio is deemed advantageous, suggesting a sustainable dividend future while supporting growth, thus receiving a positive evaluation. This approach offers a balanced assessment of WM’s dividend appeal, weighing its ability to attract income investors against its growth sustainability.
The following table illustrates the application of our grading criteria to WM’s dividend metrics, summarizing its dividend performance relative to its sector peers.
TABLE 17: Letter Grades Reflecting the Dividends of WM Relative to its Sector Industrials
| Metric | Value | Grade |
| Dividend Yield | 1.38 | B |
| Dividend Growth | 7.7 | C |
| Dividend Payout | 49.43 | D |
4.5 Summary of the Dividend Analysis of Waste Management, Inc. (WM)
Our analysis of Waste Management, Inc. (WM)’s dividend metrics offers a detailed view of its financial health and approach to shareholder returns, through Dividend Yield, Growth, and Payout Ratio. Comparing these factors within the Industrials sector, we assess WM’s position in terms of its ability to provide steady income, its dividend growth potential, and its earnings distribution strategy. This analysis not only highlights WM’s current dividend performance but also its future prospects, equipping investors with essential insights to evaluate its attractiveness as an income-generating investment in the context of broader sector performance.
Section 5 – Overall Recommendation
Our exhaustive analysis, covering Price Attractiveness, Profitability, Earnings, and Dividends, provides a comprehensive evaluation of Waste Management, Inc. (WM). Each dimension contributes to a holistic understanding of the stock’s position within the Industrials sector. This thorough examination, resulting in an overall Grade Point Average (GPA) of 2.28, leads to our investment recommendation.
The summary of our findings highlights how WM’s performance stacks against its peers. Informed by historical and sector benchmarks, this insight underscores the stock’s current standing and potential. The GPA serves as a summary representation of our analysis, guiding strategic investment considerations by considering factors such as valuation, financial strength, growth outlook, and dividend performance.
Our recommendation is based on a detailed analysis of WM, accounting for its past results and future prospects. This balanced view is important for making informed decisions, recognizing that financial markets change and WM’s Industrials industry is constantly evolving.
Based on our analysis of Waste Management, Inc. (WM)’s performance and future outlook, as outlined in our evaluation process and summarized in its GPA of 2.28, we advocate a “SELL” recommendation.